Host monitoring with Prometheus
I needed monitoring. The plan was to go for an external service - if our environment breaks down, the monitoring is still functional (at least as far as the remaining environment goes). I started to evaluate sysdig cloud, which comes somewhat recommended from “the internet”.
But then I was kinda unsatisfied (to be honest - most probably unjustified) with the service, because I really didn’t like the UI, and then one metric which was displayed was just wrong. So I got back to prometheus, which we use for metrics gathering of our running services anyway, and used it for host metric monitoring, too.
That’s my setup. (sorry for the crappy graphic, WordPress does not support SVG … ?!?)
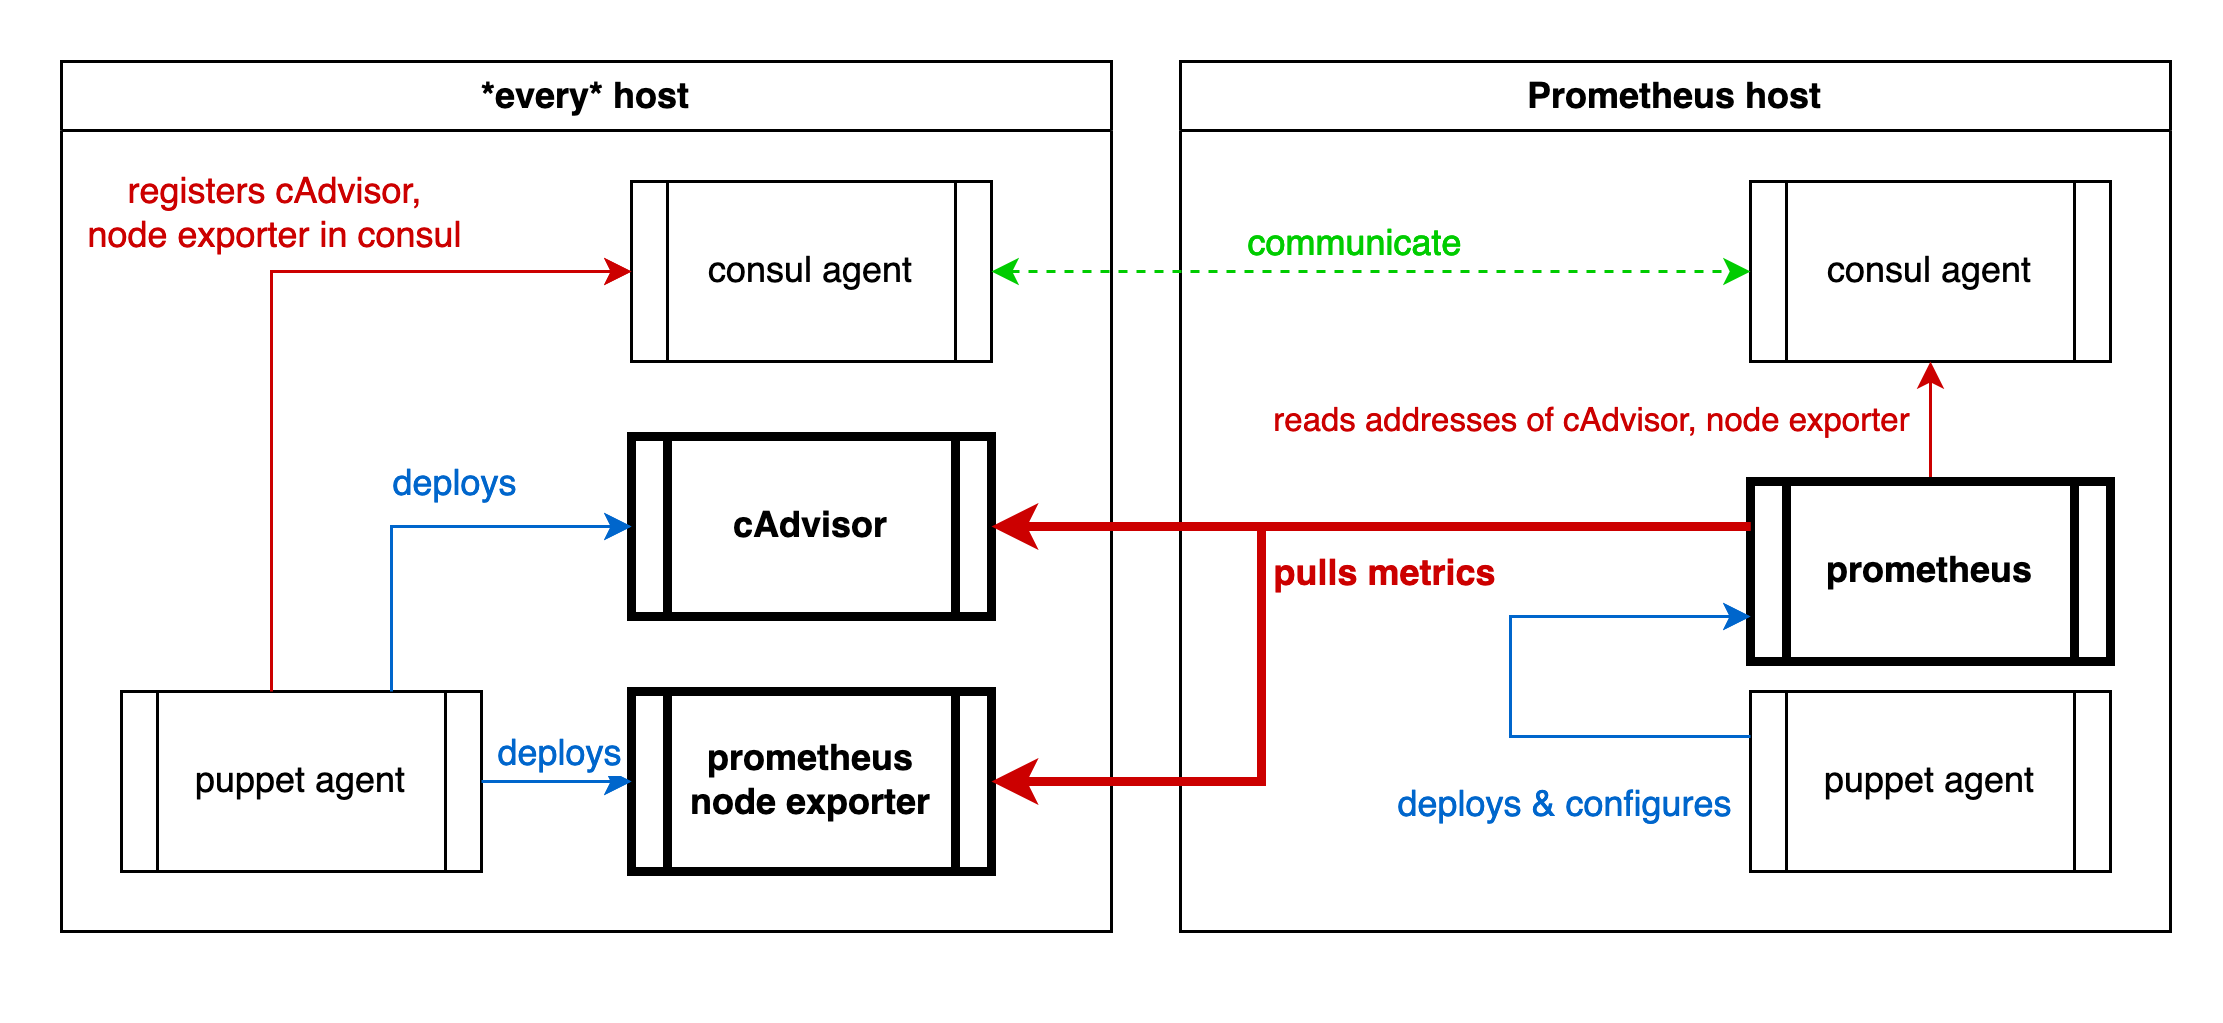
Cause I have consul running on every host, puppet deploying everything, I can use puppet to register the exporter services to consul, and consul to configure prometheus, which has native consul support.
The prometheus configuration to pull all this is pretty simple actually, once it works:
global:
  scrape_interval: 10s
  scrape_timeout: 3s
  evaluation_interval: 10s
scrape_configs:
  - job_name: consul
    consul_sd_configs:
      - server: consul.internal.net:8500
        services: [prom-pushgateway, cadvisor, node-exporter]
    relabel_configs:
      - source_labels:  ['__meta_consul_node']
        regex:          '^(.*)$'
        target_label:   node
        replacement:    '$1'
      - source_labels:  ['__meta_consul_service']
        regex:          '^(.*)$'
        target_label:   job
        replacement:    '$1'
    metric_relabel_configs:
      - source_labels:  ['id']
        regex:          '/([^/]+)/.*'
        target_label:   item_type
        replacement:    '$1'
      - source_labels:  ['id']
        regex:          '/[^/]+/(.*)'
        target_label:   item
        replacement:    '$1'
      - source_labels:  ['id']
        regex:          '/docker/(.{8}).*'
        target_label:   item
        replacement:    '$1'
Some caveats:
- Prometheus will not tell you why a relabeling does not work. It will just not do it.
- Prometheus will not tell you that a regex is faulty on SIGHUP, only on restart.
- The difference between “metric_relabel_configs” and “relabel_configs” seems to be that the former must be applied to scraped metrics, while the latter can only be applied to metrics which are “already present”, which seems to be only the “\__*"-meta labels (for example “__meta_consul_service”)
Then it works like a charm.
And the final bonbon: Directly after I had it running I discovered a problem:
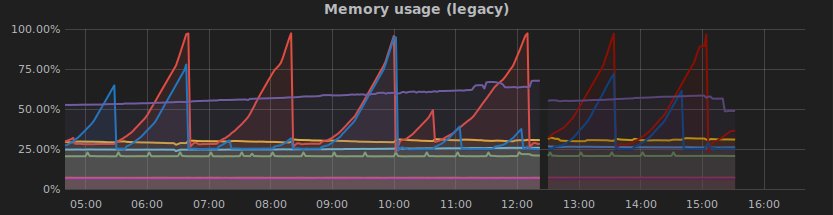
Yippieh 😀
#consul, #monitoring, #prometheus, #puppet